
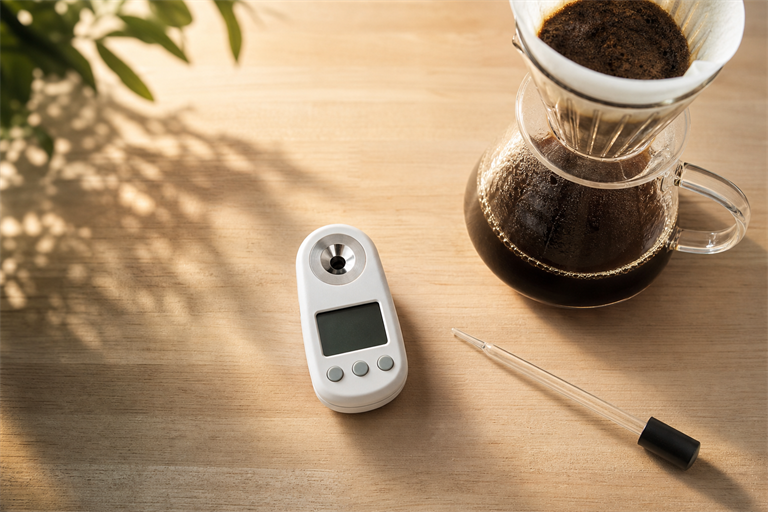
Three mornings, same recipe, three different cups. A refractometer is what finally broke that pattern for me. It turns “this one tastes thin” into a number you can chase down.
What follows is the workflow I actually run at my kitchen counter, sample prep through logging, using home gear like the VST LAB III, Atago PAL-COFFEE, or DiFluid R2.
What you’ll have by the end
- Outcome: A repeatable TDS reading (±0.02%) and an extraction yield (EY) you can act on.
- Variables that matter most: sample temperature, fines in the droplet, and calibration zero.
- Target zone for pour-over: TDS 1.15–1.45%, EY 19–22% (the SCA brewing chart range).
Gear before you start
- A coffee refractometer (optical like VST, or digital like Atago PAL-COFFEE / DiFluid R2).
- 0.45 µm syringe filters (PTFE or nylon) and a 5 mL syringe, or a paper-cone Kruve filter.
- A plastic pipette or small dropper.
- Distilled water for zeroing.
- A scale accurate to 0.1 g.
- Your brewed pour-over, fully drained, gently swirled, and decanted into a small cup.
You do not need lab gear. A $40 DiFluid plus $15 of syringe filters is enough. I bought my first strip of ten filters and got six months of weekend V60 brewing out of them.
What the number actually tells you
A refractometer measures the refractive index of the liquid and converts it to Total Dissolved Solids (TDS), the percentage of your brew that is dissolved coffee. It does not measure flavor, balance, or whether the grind was right. TDS combined with brew ratio gives you extraction yield, the percentage of the ground coffee that ended up in the cup. That distinction matters. A 1.40% TDS reading can come from a well-extracted brew or a muddy one with a finer grind. Treat the number as a starting point, not a verdict.
The measurement workflow, drop by drop
1. Swirl and decant the brew
After the Hario V60 stops dripping, swirl the carafe gently for 2–3 seconds and pour about 20 mL into a small cup. Why: the first and last drops carry very different TDS. You want a homogeneous sample, not a stratified one.
2. Cool the sample to 20–25 °C (68–77 °F)
Wait 60–90 seconds, or stir with a cold metal spoon. Why: every refractometer specifies a calibration temperature, usually 20 °C. A 10 °C error shifts TDS by roughly 0.03–0.05%, which moves your EY by nearly a full point.
3. Zero the device with distilled water
Pipette 2–3 drops of distilled water onto the prism, wait 10 seconds, hit zero. Why: prism residue and ambient temperature drift the baseline every session. Re-zero between every sample when you are doing a side-by-side.
4. Filter the sample
Draw 3–5 mL of cooled coffee into the syringe, screw on the 0.45 µm filter, and push 5–10 drops into a clean cup. Why: suspended fines and oils scatter light and inflate readings by 0.05–0.15% TDS. Filtering is the single biggest accuracy upgrade you can make.
5. Load the prism
Use the pipette to place one large drop that fully covers the prism well. Close the lid if your unit has one. Why: partial coverage or trapped bubbles read low. One drop is plenty. Flooding does not help.
6. Read three times, take the median
Wipe, re-drop, and read again. Why: digital units like the DiFluid have ±0.03% noise per reading. Three readings cancel out outliers.
7. Log immediately
Write down dose, water, brew time, grind setting, TDS, and EY. Memory is the enemy of dial-in.
Calculating extraction yield (worked example)
The formula:
EY % = (Beverage Weight × TDS) / Dose
A real brew from last Saturday:
- Dose: 18.0 g
- Water in: 300 g (1:16.7 ratio)
- Beverage weight out: 268 g (the bed held about 32 g)
- TDS reading: 1.38%
EY = (268 × 1.38) / 18.0 = 20.5%
That sits in the sweet spot Scott Rao describes in his Coffee Brewing book. Skip weighing the beverage and use water-in instead, and your EY will read about two points high. Classic beginner trap. Honestly, I made that exact mistake for weeks before I started weighing the carafe.
When the numbers don’t match the cup
| Symptom | Likely cause | Fix |
|---|---|---|
| TDS reads 0.10%+ higher than expected | Fines or oils in sample | Re-filter through a fresh 0.45 µm syringe filter |
| Readings drift down over 30 seconds | Sample still hot, evaporating | Cool to 20–25 °C before dropping |
| Two back-to-back reads differ by >0.05% | Bubble or partial prism coverage | Wipe dry, place one full drop, re-read |
| EY looks great but cup tastes thin | Used water-in instead of beverage weight | Weigh the actual liquid in the carafe |
| Zero won’t hold | Prism film or ambient temp swing | Clean with distilled water + lint-free cloth, re-zero |
| All readings creeping up over weeks | Calibration drift | Run a VST 1.00% reference fluid or factory recalibrate |
Building a dial-in log that actually pays off
Keep a simple spreadsheet, one row per brew. Columns: date, bean, days off roast, dose, water, beverage weight, grind, time, TDS, EY, taste note. Nothing fancy.
After 5–6 brews of the same coffee, patterns appear:
- EY below 19%, tastes sour: grind 1–2 clicks finer, or raise water to 96 °C.
- EY above 22%, tastes bitter/dry: grind coarser, or drop water to 91 °C.
- EY in range but cup feels weak: raise ratio from 1:16.7 to 1:15.5 (more coffee, same water).
The log is what turns a refractometer from a toy into a tool. Last week I ran a washed Ethiopian Guji on my Hario V60 (18 g, 300 g, four days off roast, Comandante C40) and watched the EY climb from 19.2% to 20.6% across three sessions, just by tightening the grinder two clicks. The cup went from lemony-sharp to round and floral. Without the log I would have called day one “underextracted” from taste alone and overcorrected the next morning.
Your next step today
Brew your usual recipe, cool a filtered sample to 22 °C, and take one TDS reading. Write down the EY. That single number is the starting line for every adjustment from here on.